The finance world is a Rorschach test
Defining pareirithmos
nothing is so alien to the human mind as the idea of randomness
John Cohen
Occasionally we have news stories about seeing Jesus in a piece of toast. Which is a perfect example of apophenia, a term coined in 1958 by a neurologist Klaus Conrad, describing the tendency to see patterns and meaning in randomness. He was mainly talking about this as something that provides delusional thinking in psychosis, but turns out much of the modern life runs on it.
Erik Hoel thinks of the entire form of AI art as pareidolia, a form of apophenia, where the patterns are created by forces immortal and that which we fall in love with because we ascribe intentionality to something that’s purely mechanical. Similarly, there should be another facet of apophenia that’s more common in the modern world, which I’m calling pareirithmos (para meaning alongside + arithmos for numbers). The tendency to see patterns in numbers.
The world with seemingly objective answers like finance and economics are particularly prone to getting hijacked by this form of numerate apophenia. The Rorschach test, when done with patients, might reveal useful hidden insights. If it was done with cells on an excel it hides the ignorance.
Nowhere is this easier to see than in the financial and economic conversations. Much like the blind men and the elephant, there are regular segments on CNBC or financial newspapers or economic substacks about the relationships between two variables. Between GDP and interest rates, between income growth and asset prices, between R&D investments and national income growth. Once you define a couple variables, both of which seem important, then you pontificate on how one affects the other. And so on and on.
This is incredibly common. For instance:
An FT story about how strength of dollar vs other currencies might cause bigger economic hits in emerging markets
An FT story about government bond prices showing a one-day move in response to Fed shifts
A NYT story about how many adults under 35 have stopped saving because of economic and social problems
Studies on the move of equities vs the correlation to crypto assets
The turmoil in 2008-09 and relationship with (any number of) household changes/ family changes/ education
Analysis of Dow rallies based on sentiment or economic data
As my friend Jim says, in the market narrative follows price, not the other way around.
What I started to wonder was what the baseline here ought to be. Because we all see patterns in numbers where there are none. Pareirithmos is the human superpower. But how many patterns is too many? What should our base level of skepticism be, in an ideal universe?
And so I came up with a test.
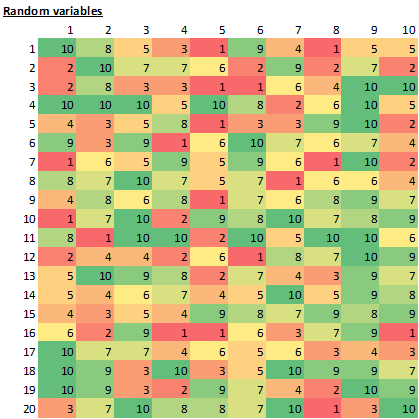
Imagine we have 10 variables. Each number is random, picked from between 1 and 10. We look at these variables over 20 time periods (time periods are rows, variables are the columns).
Now, if someone asked you whether these variables have any impact on each other, you’d say hell no. That would be ridiculous. They’re all picked at random.
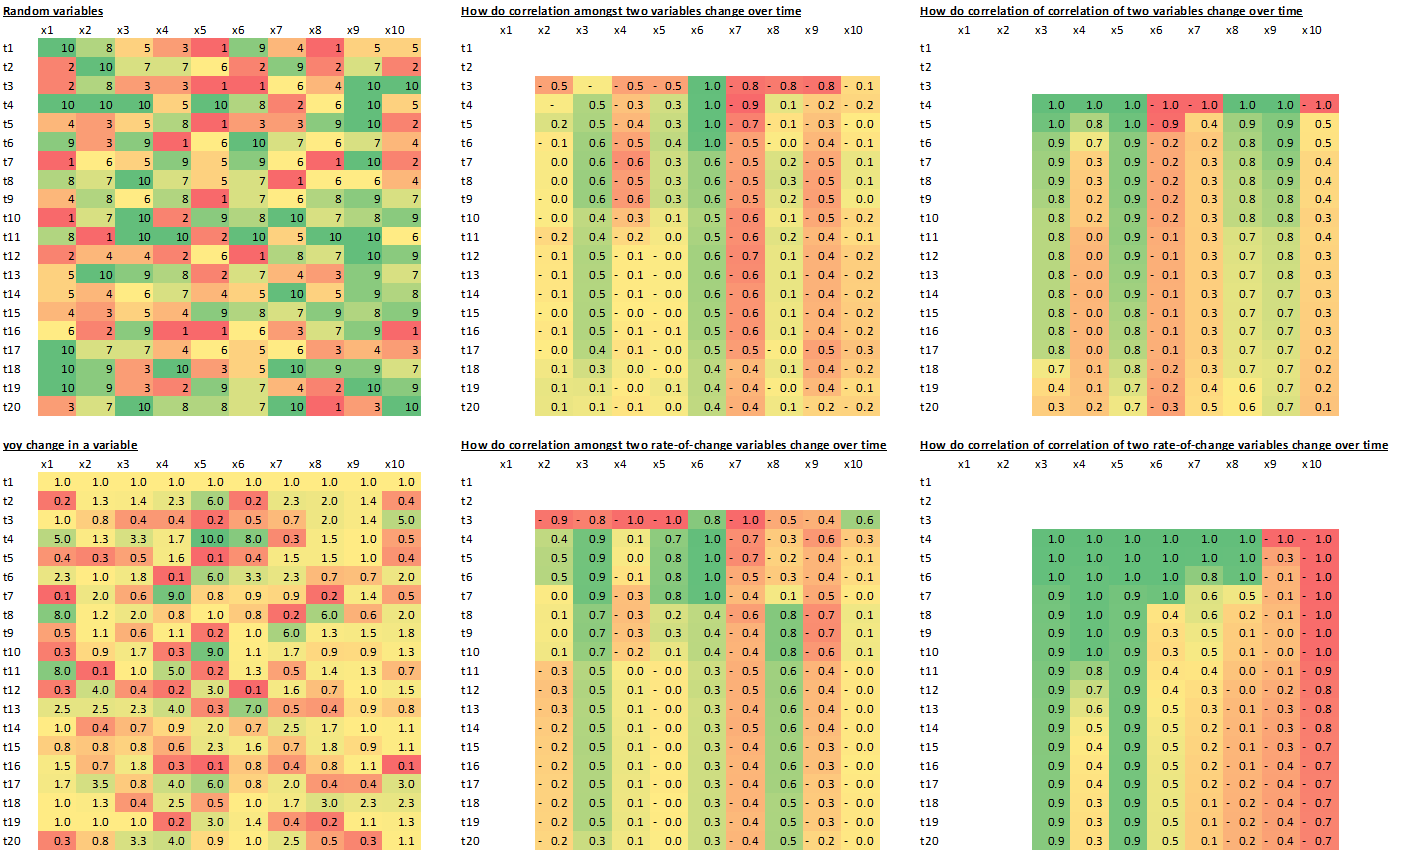
But wait, what happens if we start looking at correlations amongst these two variables, and how they change over time? For instance, if we looked at how the variables x2 to x10 seem to be correlated with x1, esp over time, the results are interesting. For a couple of these we can start to create a story. I can just see the news chyrons being printed, blonde wigs explaining the moves with plausible sounding stories.
While there are small regime changes, the correlations are pretty stable. More worryingly, occasionally one starts to show reasonably strong correlations (I’m looking at you x6). Now this is the equivalent of saying hey “GDP over time is correlated with investment patterns in brick-and-mortar industries, but only retail ones”. And it sounds very smart when you say it too!
And are these correlations robust? Sure, we can check whether the correlations of those correlations are strong. And check if (change in x1 over time) is correlated with (change in x6 over time). We continue to see the same type of pattern. Even when we’re analysing things like are we in a recession, which is a rate of change variable, its the same story.
Funnily enough, no matter how you slice it (data here) - the variable being fully random, random with a drift, yoy change of a random variable, long term average of the sum of the variables, and all combinations thereof - it comes out the same. We can still create stories pretty easily!
You could just look at this as a cautionary tale of not understanding the very granular bits of the actual data, and you’d be pretty smart to do that! Or you could look at this as the beginnings of crippling epistemic nihilism. I don’t recommend it.
When we look at things like GDP changes being caused by working from home or interest rates or asset prices or asset price changes, it’s useful to see what point estimates of correlations are useless, and estimations of regimes are more than useless. Even when the underlying data is randomly distributed it’s incredibly easy to get tricked into seeing patterns that aren’t there.
Or this example, from the real world.
By comparing the share price performance and the results of their “natural language processing” analysis — NLP is a field of artificial intelligence that teaches machines to learn the intricacies of human language — Prattle spotted an intriguing pattern. Chief executives that said “please”, “thank you” and “you’re welcome” more often enjoyed a better subsequent share price performance.
(How long do you think this piece of knowledge gets outdated by the way? Sam Arbesman says how facts break down much like radioactive materials, and some break down much faster than others. This one feels particularly radioactive.)
How much of this is relevant to our hunt for meaning? Or indeed our ability to construct a narrative that lets us create a meaning for our lives without worrying about exact correspondence with reality and the possibility of hitting errors of omission or commission regularly?
A lot, it would seem. If we’re too humble and epistemically helpless and unable to draw conclusions because they might be wrong and the patterns might be at best fleeting or at worst mistaken, then we’re doomed to a life of confusion. More confusion, anyway. Pareirithmos is the same as a Type I error in statistics, in seeing patterns where there aren’t any.
But that’s no way to live. We do need to create patterns to enjoy and experience life. If not in CNBC shout-television, at least in life, and planning to buy the right groceries so your partner won’t laugh at you.
When Archimedes ran naked from his bath shouting Eureka!, it was because he had a moment of revelation of how a whole bunch of things just clicked together to form a complete picture in his mind. He saw a true pattern. The counterpoint to apophenia is the phenomenon of epiphany.
Innovation, like with Archimedes, seems to proceed through epiphanies. Ourobouros eating its tail leading to Kekule’s understanding of the benzene molecule, Francis Crick being under LSD when the double helix structure for DNA clicked for him, Newton’s semi-concussionary apple, Darwin’s “hunch” about natural selection. Not to mention any number of religious, moral or personal epiphanies, when a bunch of different strands seem to just cohere into a whole picture.
The boundary between a true epiphany and an episode of apophenia is fluid. One man’s theory of everything is another man’s flat earth theory. Einstein’s thought experiments on what the world would look like if he stood on a beam of light straddles the boundary.
There’s an old didactic Vedic parable about a rope and a snake. Imagine it’s the evening, the light is low, and you come across a coiled rope and think its a snake. You get scared! Is your fear real? You realise as you’re closer that no, it’s a rope. It’s hard to see in the dark. What can you do the next time to make sure you see the rope, and not the snake.
One difference is intent. If you’re looking for a pattern, you’re likely as not to make yourself see things. And if you’re paid to look for patterns, you’d find them everywhere.
A second, and bigger, difference is that epiphanies seem like instant moments of divine revelation, but are actually the endpoint of large amounts of effort. The scientists above, and any number of financial and economic commentators, spend their whole life trying to understand the elephant by revising and re-describing the trunk, tail and torso they’re blindly touching. For them the story of two variables seeming to be correlated is so much richer than one causes the other.
We have built our economic infrastructure by playing pattern bingo. In the markets the first person to discern a true pattern wins, even if the cost is seeing a large number of false ones. In science, you see that some of the most creative, innovative, minds were also riddled with ideas and thoughts of patterns that were crazy. Newton wrote far more about his theories of codes in the Bible and alchemy than physics or mathematics.
Maybe it’s inseparable, much like the double helix. In which case maybe we find ourselves cherishing the existence of the financial talking-heads urging connections of one thing to everything. You shouldn’t romanticise madness to attract genius, but as my friend Matt Clifford talks about variance amplification, it can’t be done without actual amplification.
One lesson here could be that we should be nicer to the economic-financial-media world for seeing conspiracies and crazy connections everywhere, and take all their theorising with huge chunks of salt.
But another, and more productive idea is to say that apophenia is the price we pay for epiphanies. Even pareirithmos which surrounds us can be useful if taken as an invitation to explore, rather than a true description of the world.
The pursuit of meaning is the noble goal that drives our species. We see this in the mundane, like asking the tea leaves of quarterly numbers to explain the present and predict the future for us, to the divine in seeing Jesus on a potato. But if you do find Jesus on a root vegetable or an incredible investing opportunity in a mass of equities data, that too is well and fine. Your sincere belief in that pattern guides an action, which has a consequence, that hopefully results in future actions being corrected.
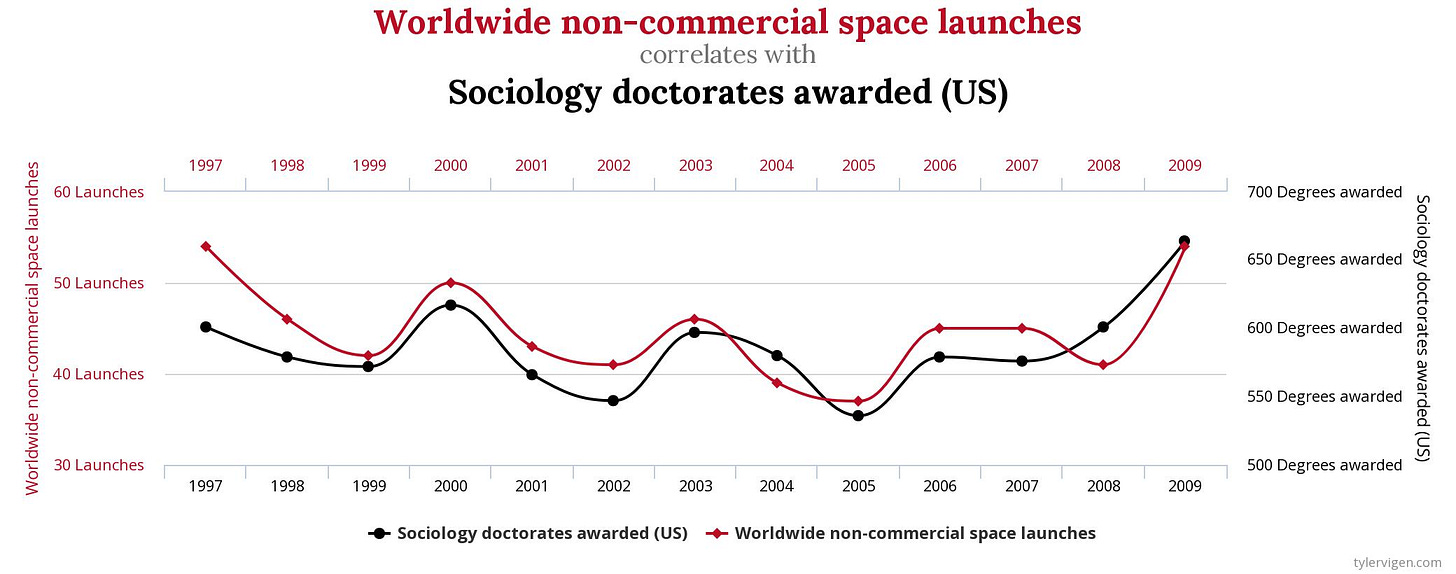
But if you’re a step removed and looking everywhere to find Jesus on a piece of toast, you’re in performative fraud territory. Especially if what you’re selling has no real basis in fact, except for pointing at charts and going “hmmm, isn’t it crazy that these two things move together”, while not realising your equating Kentucky marriage rates with fishing boat deaths.


Very related: "Fooled by Randomness" from Taleb
Judea Pearl's comment about "floundering on the shores of confounding variables" comes to mind. Given that we measure four million economic variables and there have been 10 recessions in the last 10 decades (just saying) then something will correlate. Same shit happens in medical research.